
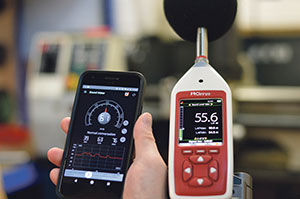
There has been a growing trend of sound level meter apps being available on mobile phones and tablets to provide noise measurement functions.
Some of these apps have been designed to meet – if used with a suitable external microphone – relevant instrumentation standards. The vast majority are also available as free downloads from the Google Play Store or Apple App Store.
Sounds tempting? Particularly when faced with an upfront investment or the costs of engaging acoustic consultants. However, there are some caveats.
The risk of NIHL claims (Noise Induced Hearing Loss) is still acute. The Compensation Recovery Unit claims portal data found a dramatic rise in NIHL claims this decade w
ith figures showing a 139% increase 2011-2014 from 18,570 to 44,158. In 2015, the figure went up a further 8%.
How Widely Used are Sound Level Meter Apps?
A significant portion of noise measurement equipment sold in the UK and overseas is for compliance with regulations such as the Control of Noise at Work (2005). A Cirrus survey found within Noise at Work, users often used sound level meter apps as a way of making an initial assessment of noise levels or to give stakeholders a simple way to raise concerns.
Internal or External Microphone?
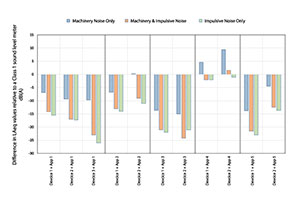
The question on their accuracy using an internal microphone has been discussed at length. One paper showed that using the same app across a number of different devices and in a controlled environment gave differences of between -28dB(A) and +10dB(A) when compared to a sound level meter.
The most significant differences were when the noise contained a high proportion of low frequency content or where the measured noise contained a significant impulsive component (not uncommon within a manufacturing environment).
It’s clear from this data that the more impulsive content, the larger the difference the reference measurement can be.
Another recent test of a sound level meter app using a new iPad showed a discrepancy of up to 10dB between measurements. This appeared to be caused by the use of multiple microphones on a device, especially where one or more of the microphones is being used automatically for noise cancellation. This effect was even more pronounced at low levels below 40dB(A).
 Positioning of the Device
The positioning of the device has also been shown in previous studies to be a significant factor upon the frequency response of the measurements.
Most smart phones use a microphone that is positioned at the lower edge where the user’s mouth should be. Some devices now use multiple microphone capsules spread over the device to allow for noise cancellation, enhancing the speech quality. The microphone location on tablets is even more variable as these aren’t intended for calls.
Standards, Consistency, Repeatability
The question is whether this type of sound level meter app could, or should, be used where there is a standard or regulation to meet.
Most sound level meters currently being manufactured comply with IEC 61672-1, often with the subsequent Type Approval to IEC 61672-2 and then periodic verification to IEC 61672-3. The regulations to which most of us are working specify an instrument should meet Class 1 or Class 2 of this standard.
Addressing this, the user instructions for the NIOSH Sound Level Meter App contains a disclaimer that “…we want to emphasise that smartphones and smartphone sound apps were not designed to meet such rigorous standards and that this app does not meet Type 2/Class 2 standards….and should not bused for compliance purposes”. Other sound level meter apps have similar statements or none at all.
What is Being Measured?
An evaluation of 25 sound level meter apps on the Google Play Store showed that only 6 labelled the metric displayed correctly. The majority were using SPL, often with no indication of the frequency or time weighting being used.
Where some form of averaging was available, only 8 of the sound level meter apps used displayed Leq or TWA as a metric. The others used Average or Mean as a descriptor, using a visual check using a controlled noise source that stepped by +20dB, some even appeared to be using a linear average.
The clear risk here is that the user may not be aware of whether the app is providing the appropriate metric or whether the processing of raw data to provide those metrics is correct.
Contact
T +44 1723 891655
sales@cirrusresearch.com
www.cirrusresearch.co.uk